The Triple (or Triply Resonant) Sum Frequency (TSF/TRSF) pathway is a four-wave-mixing (FWM) pathway involving a ladder climbing of states resulting in an output coherence at the triple summation frequency of the inputs. In cases we have explored so far, we have coupled two vibrational transitions to one electronic transition. TSF refers to the case where the electronic transition is virtual, like a non-resonant Raman transition. This is represented as a dashed line in the Wave-Mixing Energy Level (WMEL) diagram. We examined how this pathway manifests in neat benzene solvent, and the spectrum is shown below.
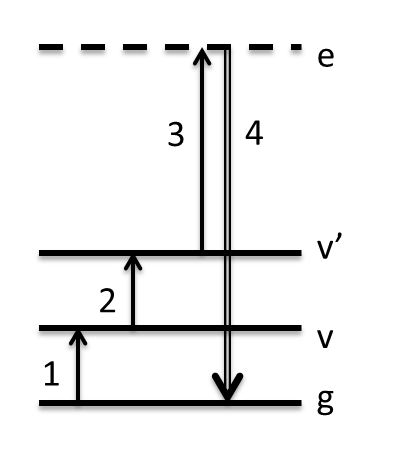

In the data above, w1 interacts first and excites the fundamental C=C ring breathing mode of benzene at the frequency you observe in the infrared spectrum. w2 interacts 1.5 ps later, and since it is only allowed a positive interaction it climbs to a combination band or overtone state coupled to the fundamental. The diagonal peak is the overtone transition and appears anharmonically shifted from the fundamental. However, the cross-peak at 1580 cm-1 does not correspond to any fundamental mode in the IR spectrum. To understand this peak, one must consider the Raman transition that follows. It appears that it must be a two-quantum Raman transition since it originates from a combination band or overtone. However, 2-quantum Raman transitions are inherently weak, and they often borrow intensity when they have accidental degeneracy with a fundamental mode. If we add the frequency of the fundamental C=C mode to the w2 axis frequencies and plot that on the right, we see what part of the spectrum must have Raman intensity, and indeed the peaks line up. The cross-peak is the so-called A1g C-H stretch mode. But how can we have transiiton intensity from one fundamental (C=C) to another (C-H)? The answer is that since the C=C overtone and C-H stretch are mixed in a Fermi resonance, each eigen state actually contains character of both 2vCC and vCH. This allows the w2 transition from C=C to the primarily C-H stretch, and it allows Raman intensity from the primarily C=C overtone state back to the ground state. It turns out that the availability of Fermi resonances becomes an important criterion for whether a pair of states will have TSF signal. Further description of TSF can be found here.
We can examine the formalism for predicting TSF intensity. We start with a X(3) nonlinear susceptibility that is familiar to other FWM strategies.

We would like to express this in more familiar variables, such as the absorption coefficient and the Raman cross section (which contains vibronic transition dipole moments such as appear above).
 ,
, 
The overall intensity depends upon the nonlinear susceptibility, path length, input intensities, and an M-factor. The M-factor takes into account phase-mismatch and absorption effects. These did not play a role in the data on this page but can become important.

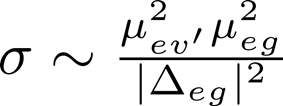
Replacing variables within the susceptibility results in the following proportionality for a T(R)SF intensity (for simplicity we assume on-resonance with the vibrational states and an impulsive excitation). Here a2 is an excited state absorption coefficient, which will be related to the ground state absorptivity but also depends upon coupling to the primary chromophore. The Raman cross-section is the "two-quantum" Raman transition. We know from benzene that that term of the intensity in TSF can get a boost from a Fermi resonance of the overtone or combination band v' with a fundamental mode.

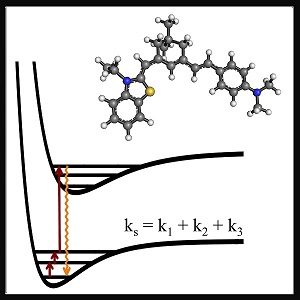
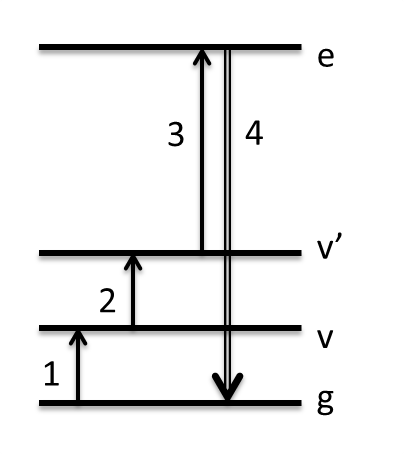
In TRSF, we explore boosting that Raman cross-section instead by resonance with an electronic state. This has two important results: (1) output intensity increases substantially, allowing lower concentration solutes to be analyzed. (2) It allows all cross-peaks to be seen for modes that have their potential energy surface altered in the excited electronic state, whereas in TSF cross-peaks are more likely to be the fundamental Fermi resonant pair than a true combination band. The picture on the left below shows how the summation of the 3 input frequencies climbs to the excited electronic state. The molecule used to describe this method is the conjugated laser dye Styrl 9M. It has a bright absorption in the visible at 560 nm. Our 800 nm pulse and two infrared pulses climb to about 650 nm in these scans -- about halfway up the red side of this resonance. The spectrum below was taken with just 300 micromolar Styryl dye, or about 1 mOD in the infrared, representing a serious advantage over non-electronically enhanced 2D vibrational spectra.


The spectrum above was taken with w1 and w2 temporally overlapped, giving symmetry across the diagonal. All modes are coupled due to significant delocalization in the conjugated system. The dye also undergoes major conformational changes in the excited electronic state (eventually leading to isomerization), and this likely aids all modes in coupling through the excited electronic state since all will be displaced. We can also impose a time delay between the infrared pulses to force w1 to interact with a fundamental and w2 with an overtone or combination band state. This allows one to measure the mechanical anharmonicities as the difference in the frequency of those two interactions. This data is shown on the right below.

The mechanical anharmonicities measured here are all <4 cm-1. This is important since that is a small enough number that destructive interference in 2D-IR would become a significant problem. Two other things also happen in this spectrum. One is the large antidiagonal feature splitting into two peaks at (1530,1530) and (1510,1545) cm-1. Since the latter peak only appears on one side of the diagonal, it is again a Fermi resonance as was seen in benzene. The 1530 cm-1 diagonal will sum to the same frequency so is likely also part of this Fermi resonance. The other feature is that the w1=1460 cm-1 peak has clearly split into two peaks at w1=1460,1480 cm-1. In the FTIR there are two comparable peaks at 1464 and 1474 cm-1. Since this frequency difference is within the bandwidth of our pulses, frequency domain quantum beating occurs, where the peaks will merge and split at the beat period of 2*pi/(wb-wa), or ~3.5 ps in this case.
TRSF as the "Resonance IR" analogue to Resonance Raman
TRSF provides electronic enhancement of IR-active (rather than Raman-active) modes. These are modes whose dipole moment changes along the vibrational coordinate, rather than their polarizability changing along the vibrational coordinate. In a high symmetry molecule (one with an inversion center), IR- and Raman-active modes are mutually exclusive. To demonstrate electronic enhancement of IR-active modes, we did TRSF on the centrosymmetric molecule tetrasulfonated copper phthalocyanine (Cu(tsPc)4-). Cu(tsPc)4- additionally has biological relevance because of its structural/electronic similarity to porphyrins that are found in heme proteins. The experiment was also done in D2O to demonstrate a more biologically relevant solvent. On the left is the 2d vibrational data for a 5 mM sample, divided by a calculated M-factor accounting for phase-mismatch and absorption effects. Above it is the attenuated total reflectance (ATR) IR spectrum of solid Na4Cu(tsPc)4. The infrared pulses were overlapped in time as is shown in the WMEL diagram. On the right is an overlay of the FTIR spectrum of the 5 mM sample, the resonance Raman spectrum, and the "resonance IR", or TRSF diagonal slice, spectrum. The modes enhanced are not the same.


An interesting detail to note is that the modes at ~1600 cm-1 in the ATR spectrum do not rise above the background in the TRSF spectrum. Density functional theory (DFT) assigns these modes to vibrations localized on the outer phenyl rings of Cu(tsPc)4-, while the lower frequency modes that are present in the TRSF spectrum are located primarily on the inner rings of Cu(tsPc)4-. We predicted, therefore, that the Q-band electronic transition we used for electronic enhancement did not change the electron density on the outer phenyl rings and therefore provided no electronic enhancement of those vibrations. To confirm this, we ran time-dependent density functional theory (TDDFT) on copper phthalocyanine in ORCA and generated an electron density difference map (EDDM) for the Q-band transition. Indeed, it confirmed that most electron density changes occurred in the inner part of the macrocycle.

Density increase is shown in red, and density loss shown in blue. This result indicates the electronic enhancement in TRSF can serve not only to enhance a weak signal, but also to gain qualitative information about the nature of an electronic or vibrational transition, and how they impact one another. This is exactly the type of information you would want when studying the mechanism of an active site.
See more about where we are going with this technique HERE!